13 Dec 2016
This time Allstate Insurance Company sponsored a “recruitment” competition in Kaggle to predict the cost of insurance Claims so that the severity of a Claim can be determined in an automated way. The determination of Claims severity will improve Claim Service that Allstate provides to its customers, which in turn will improve the Customer Experience for the 16 million households it protects today.
The competition ran from 10-Oct-2016 to 12-Dec-2016 and there were 3055 individuals who participated across the globe.
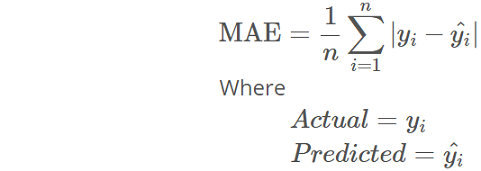
The dataset comprised of 116 categorical and 14 continuous features. The “loss” feature given in the train dataset is the one that had to be predicted from the test dataset. Mean Absolute Error (MAE) - measure of how close the predicted values are to the eventual outcomes or actuals, was used to evaluate and score the loss prediction. Refer to any of my code files in Github - Allstate folder for its implementation.

To test my submission file and to know where I stand in Public Leaderboard, I prepared a quick and dirty XGBoost Model with basic and default parameters. After that I built the following set of models to ensemble:
- Generalized Boosted Regression Model (GBM) with Out-of-Bag (OOB) estimator, Gaussian distribution, and 5-fold cross-validation
- 5 H2O Deep Learning Models each with 2 levels of hidden layers, 20 epochs, Huber distribution, and Rectifier activation
- 10 folds of MXNet Deep Learning Models each with 2 levels of hidden layers and one-hot encoding
- ExtraTrees Model with one-hot encoding and 3 random cuts for each feature
- XGBoost Model with parameter tuning and feature engineering
After creating the above models, I took arithmetic mean of all the predictions. Then I ensembled by applying different weightage to each model’s predictions, cross-validated, and then submitted. Finally, at the end of the competition, I could get into top 20% (604 out of 3055) in Private Leaderboard.
Refer below for first few rows of submission file:
| id |
loss |
| 4 |
1626.451 |
| 6 |
2034.433 |
| 9 |
10186.82 |
| 12 |
6364.859 |
| 15 |
838.1675 |
| 17 |
2330.886 |
| 21 |
2103.839 |
| 28 |
902.1843 |
| 32 |
2544.185 |
| 43 |
3245.454 |
One of the key challenges with this competition was the size of the data, after feature engineering and one-hot encoding. In order to process the data and generate the models, I used the Domino Data Lab’s computing platform. For most of the above models, I chose Medium Hardware Tier (4 core. 16GB RAM) costing around $40.

02 Mar 2016
Telstra is Australia’s largest telecommunications, media, and network technology company, offering a full range of communications services. They conducted their first-ever “recruitment” competition in Kaggle to predict the severity of service disruptions on their network - whether it is a momentary glitch or a total interruption of connectivity. The algorithm and model developed for this competition will help Telstra to predict the severity of service disruptions and provide better service to its customers.
The competition ran from 25-Nov-2015 to 29-Feb-2016 and there were 974 individuals who participated across the globe.
The dataset was comprised of multiple files each containing different features extracted from Log files, collected from various locations at different times. The target feature, Fault severity with 3 categories (0: No Fault, 1: Few Faults, and 2: Many Faults) was the one that has to be predicted from the given datasets. Again, the prediction should be the probability of each severity type (multi-class) for the given test dataset.
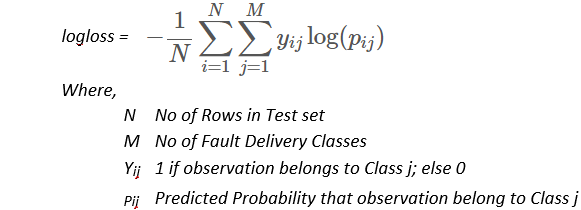
In this competition, Multi-class logarithmic loss was used to evaluate the performance of predicted multi-class probabilities.

I generated the following set of models to submit them individually and then to ensemble:
- Generalized Boosted Regression Model (GBM) with Out-of-Bag (OOB) estimator,
repeatedcv, and 5 separate 10-fold cross-validations
- Random Forest Model with Out-of-Bag (OOB) estimator,
repeatedcv, and 8 separate 10-fold cross-validations
- Stacking (Meta-Ensembling) of Random Forest and GBM Models
After creating the above models, I took the arithmetic mean of all the predictions. Then I ensembled by applying different weightage to each model’s predictions for submission.
Refer below for first few rows of submission file:
| id |
predict_0 |
predict_1 |
predict_2 |
| 2 |
0.991082892 |
0.007185119 |
0.001731983 |
| 3 |
0.276082613 |
0.609547675 |
0.114369705 |
| 4 |
0.951721534 |
0.044502856 |
0.003775634 |
| 7 |
0.235435281 |
0.231292959 |
0.533271745 |
| 9 |
0.071940752 |
0.187302526 |
0.74075672 |
| 10 |
0.839680135 |
0.126305137 |
0.034014717 |
| 11 |
0.564171374 |
0.428022489 |
0.007806152 |
| 12 |
0.882261053 |
0.110307094 |
0.007431867 |
| 14 |
0.457473055 |
0.532052293 |
0.010474668 |
| 15 |
0.78682138 |
0.207976922 |
0.005201698 |

16 Feb 2016
This ‘Featured’ Kaggle competition was from Prudential Life Insurance to assess and identify risk classification of customers based on their extensive personal and medical information. This will help Prudential to shorten their current 30-day turnaround to be fast enough to produce the quote and send it out to customers.
The competition ran from 23-Nov-2015 to 15-Feb-2016 and there were 2619 teams who participated across the globe.
In this Supervised Learning, customers’ personal and medical information, life insurance product chosen, and actual risk were provided in Train Data set. The quadratic weighted kappa, which measures the agreement between two ratings, was used to evaluate and score the Risk prediction. Refer here to understand more about how to evaluate it on predicted value.
To predict the risk classification, I first tried with Recursive-Partition (rpart) Classification Tree Model to understand the performance of this basic model. It scored 0.60115 in Public Leaderboard. After that I built the following set of models:
- Random Forest Model from
caret library
- Machine Learning in R Model from
MLR library. Used both count:poisson and reg:linear objectives with multiple rounds
After preparing multiple predictions with various rounds, objectives, and algorithms, I did a mode of all the outputs and arrived at my final submission. Finally, at the end of the competition, I could get into top <19% (485 out of 2619) in the Private Leaderboard.

27 Jan 2016
Another recruitment competition hosted by Kaggle for a British Investment Management Firm Winton, to predict the intra and end of day returns of the stocks based on historical stock performance and masked features. The competition ran from 27-Oct-2015 to 26-Jan-2016 and 832 members participated from all over the globe. Like in other recruitment competitions, forming of teams was not allowed.
In this competition, Weighted Mean Absolute Error was used to evaluate the performance of predicted Stock Returns. The R code for this evaluation metrics can be found here.

Working with this competition was bit more challenging since there were 211 features and the Train dataset was ~173 MB.
Since the preparation of output file alone was taking hours to process, I had to work with R code to load data and calculate results. Java code was used to format and prepare final submission file.

28 Dec 2015
This recruitment competition was with Walmart through Kaggle to categorize and classify customers’ trips to their stores - whether it was a daily dinner trip, weekly grocery trip, special holiday gift trip, or for seasonal clothing purchase. In fact, this was a Multi-class Classification Probabilities competition in which the probability of each classification has to be predicted for each trip by a customer and recorded in Test Dataset, after learning from the Train Dataset.
The competition ran from 26-Oct-2015 to 27-Dec-2015 and 1047 members participated in total. Being recruitment competition, forming of teams was not allowed and the number of participants were lower than other ‘featured’ competitions.
Personally, I like recruitment competitions because no code sharing is allowed in the competition’s public forum. That encourages participants to come-up with their own logic and algorithm selection.
In this competition, Multi-class logarithmic loss was used to evaluate the performance of predicted probabilities.

To predict the probabilities, I used Random Forest with 4-fold repeated cross-validation. It is important to set classProbs=true in trainControl object before passing it into RF model for multi-class probabilities.
trcontrol <- trainControl(method = "repeatedcv", number = 4, repeats = 2, verboseIter = FALSE, returnResamp = "all", classProbs = TRUE)
The complete code for Random Forest model can be found in my Github here.
- - - - -
A good thing with XGBoost algorithm is that it has a built-in mlogloss evaluation metric type that can be passed as a parameter while training the data.
xgbcv <- xgb.cv(param = list('objective' = 'multi:softprob', 'eval_metric' = 'mlogloss', 'num_class' = noOfClasses), data = trainMatrix, label = Target, nrounds = cv.round, nfold = cv.nfold)
The complete code for my XGBoost model can be found in my Github here.

15 Dec 2015
This was my first-ever Kaggle competition in which the daily sale of 1,115 Stores located across Germany had to be forecasted for the next 6 weeks using promotions, school and state holidays, seasonality, locality of store, and competitor data. The competition ran from 30-Sep-2015 to 14-Dec-2015 and 3303 teams participated. In this Supervised Learning, the sale of previous 2 years 6 months data were given as the Train Dataset, and Root Mean Square Percentage Error (RMSPE) metric was used to evaluate and score the prediction.

Being first competition, it was challenging to understand the competition ecosystem and dynamics. I became a forum-dweller for a couple of weeks reading all the posts and replies, and then I created my first model in R using basic Linear algorithm. This scored 0.61328 in Private leaderboard and here is the Code in Github.
A good thing about reading Forum posts is that you will get to know plenty of other algorithms that are not taught in regular courses. One such algorithm is XGBoost (Extreme Gradient Boosting). As someone stated in the Forum, it is the algorithm that gives out Gold even when you pass garbage as Input. I tried using XGBoost with minimal feature engineering on this data set.
# Extract Day, Month, and Year from Date object and then remove Data object
merged_train$Day   <- day(merged_train$Date)
merged_train$Month <- month(merged_train$Date)
merged_train$Year  <- year(merged_train$Date)
merged_train$Date  <- NULL

# Separate Sales figure from merge data and convert it to log scale to bring down its dimensionality.
merged_train$Sales <- log1p(merged_train$Sales)
The complete code with Feature Engineering can be found in my Github here.
This Github link contains another flavor of XGBoost with Feature Engineering and Parameter Tuning.


