How to identify the features that are important for a Machine Learning model?
In one of the recent meet-ups, I was asked, which is important for generating a good Machine Learning (ML) model - A good Data Scientist or Data? That is an interesting question, right?
A data scientist can be hired, trained, or outsourced by any enterprise at any time, but how about the data? The data can only be captured and collected by that enterprise alone, through their core business processes, over a period of time. Data collection takes time; it requires infrastructure and software components to be in place. Of course, external sources, either publically available or third party data, can be leveraged as supplemental sources for improving the machine learning model efficiency but the core secret sauce i.e. data has to come from the enterprise itself.
The next challenge is to identify whether the data captured is good or bad. In other words, are all the captured features important for the generation of a good machine learning model? A good domain knowledge may help answer this question partially, but how to identify and prove it mathematically? Well, this challenge can be approached either using Statistical methods or using Machine Learning models itself.
Statistical Method:
In this method, we do not create an actual machine learning model using any algorithms but we use the given dataset to analyze how the features are correlated to each other. Chi-squared and Adjusted R-squared are the two majorly used metrics that can be employed. Though there are many methods viz All-in, Backward Elimination, Forward Selection, Bi-directional Elimination, and Score Comparison, Backward Elimination (a stepwise-regression technique) is the widely used method in the industry.
This can be achieved using Gretl - an open-source statistical software package provided by SourceForge. Gretl User Guide is a good resource to start with for this exercise. Follow the below steps to perform backward elimination:
-
Select a significance level (SL) (say, 0.05)
-
Fit a model using Gretl with all available features (predictors). The dataset (50-Startups.csv) used for this analysis can be found here
-
Identify the feature with the highest P-value
-
If the P-value of a feature is higher than SL, remove that feature and refit the model with remaining features
Note: Even if there are multiple features whose P-values are higher than the selected SL, remove only the one that has the highest P-value and fit the model again. This is because the removal of one feature will impact the constants, coefficients, and P-value of other features. Further, as we selected an arbitrary value for SL (as 0.05), it is necessary to compare the models before and after removing the selected feature for Adjusted R-squared metric (or Chi-squared) as well.
-
Do the steps 3 and 4 to a point where the selected features yield highest Adjusted R-squared values and/or the P-value of features is less than the selected SL. After reaching that point, the list of features collected are the ones that are important for building a good machine learning model
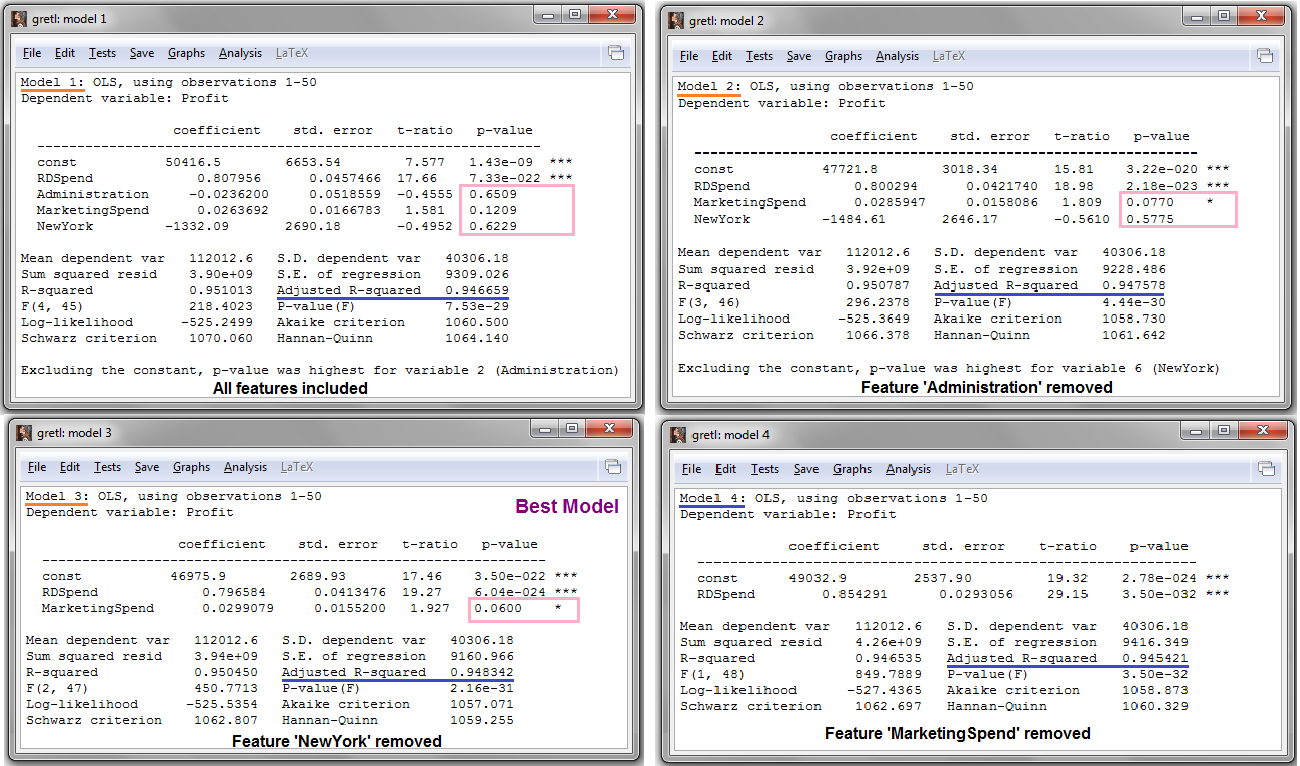
In the above picture, Model 4 contains all the features whose P-value are less than 0.05. However, its Adjusted R-squared value is less than that of Model 3 that contains a feature that has P-value greater than chosen SL (0.06 > 0.05). In spite of this feature, Model 3 (thereby the features in it) has to be selected as the best one based on its highest Adjusted R-squared value. From Model 3, the important features that required for generating a machine learning model, which can predict the target feature, are RDSpend and MarketingSpend.
Machine Learning Model:
In this method, we create an actual machine learning model using one of the algorithms that output importance matrix as part of the model generation. This matrix will provide details about each feature in a dataset and its percentage of importance in generating the model
Let us take a simple Random Forest Regressor model to arrive at the important features using the same dataset (50-Startups.csv) we used for the statistical method.
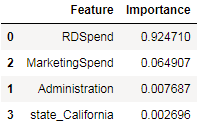
The above code prints a table with the percentage of importance of each feature in descending order, as shown below. This clearly indicates that RDSpend and MarketingSpend are the two features that are majorly important for generating a model that can predict the target feature.
Conclusion:
From both Statistical and Machine Learning methods, it is evident that RDSpend and MarketingSpend features are the ones that are required to determine the Profit of a startup company. The other features are not significant enough to be included in a model and hence they can be rejected.
Further, these selected features can be used as a feedback mechanism to business processes that capture data or to the process that aggregates data from different data stores for model generation. This will drastically reduce the number of features that need to be captured for model generation and during real-time prediction.