Performance Metrics - Linear Regression Models
Socrates, one of the greatest Greek philosophers of mankind, once said, “The unexamined life is not worth living.” This famous quote can be adapted to Machine Learning models as well. If this quote has to be rewritten to ML world, it will read as “The unexamined ML model is not worth-production.”
An important aspect of the predictive modeling pipeline is, measuring the performance of the model developed. It determines how best the model fits the purpose. The performance of model is measured by running the model on unseen dataset and comparing the output with actual results. There is no one type of metric that can be used to measure the performance of the models. In other words, the techniques used for regression models cannot be applied to classification or clustering models. Let us look at various evaluation metrics used for Linear Regression and how they are important to a business problem.
a. MSE - Means Square Error (L2 Loss)
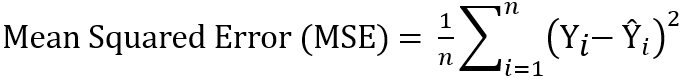
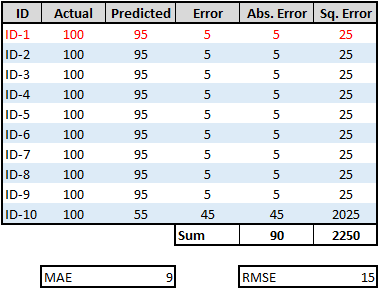
Mean Squared Error (MSE), also known as Least Squares Error (LSE), is the simple and commonly used evaluation metrics for linear regression. To compute MSE, take the difference between actual and predicted values of each observation, square the differences, and then find out the mean. MSE represents both the variance and bias of the predicted values.
If the outliers represent anomaly that is important for business and should be detected, then we should use MSE. Note that MSE is sensitive to outliers, but it gives a more stable and closed-form solution.
The unit of MSE is square times the unit of the predicted value. The MSE can be calculated using the sklearn library as below:
b. RMSE – Root Mean Squared Error
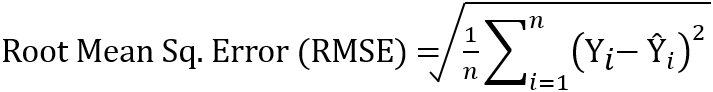
Root Mean Squared Error (RMSE) is the next simplest form of evaluation metrics used for linear regression. To compute RMSE, first, compute MSE as stated above and take a square root of the final value. The square root is taken to arrive at the scale of the error same as the scale of the predicted value. In other words, the unit of RMSE is the same as the unit of the predicted value. As RMSE is the square root of MSE (Variance), it represents the Standard Deviation of the error.
Note that any outliers present in the data will magnify the error term to a higher value.
The RMSE can be calculated using the sklearn library as below:
c. RMSLE - Root Mean Squared Logarithmic Error
The Root Mean Squared Logarithmic Error is calculated by taking the log of actual and predicted values before computing the error. After taking the log values, it is the same as computing the RMSE. RMSLE is used in cases where the predicted values above the actual values (overestimation) are preferable than the predicted values lower than the actuals (underestimation). Further, RMSLE considers only the relative error between the actual and predicted values and not the scale of the error.

The RMSLE can be calculated using the sklearn library as below:
RMSLE is used when both the predicted and actual values are big numbers. It is used if the huge differences between the predicted and actual values are not to be penalized.
d. MAE - Mean Absolute Error (L1 Loss)
Mean Absolute Error (MAE), also known as the Least Absolute Deviation (LAD), is the average of the sum of the absolute difference between actual and predicted values. In other words, calculate the difference between actual and predicted values of each observation, compute their absolute values, sum it up, and then determine the average. MAE function tries to reduce the absolute differences between the actual and predicted values.

If the outliers represent corrupted data, then we should choose MAE as a loss function. Unlike MSE, MAE is insensitive and more robust to outliers.
The MAE can be calculated using the sklearn library as below: